From Wikipedia, the free encyclopedia
1929 Belgian general election|
|
|
|
|
First party
|
Second party
|
Third party
|
|
|

|

|

|
| Leader
|
Henri Jaspar
|
Joseph Van Roosbroeck
|
Albert Devèze
|
| Party
|
Catholic
|
Labour
|
Liberal
|
| Leader since
|
Candidate for PM
|
1918
|
1927
|
| Last election
|
78 seats, 37.42%
|
78 seats, 39.48%
|
23 seats, 14.65%
|
| Seats won
|
71
|
70
|
28
|
| Seat change
|
 7 7
|
8
|
 5 5
|
| Popular vote
|
788,914
|
803,347
|
369,114
|
| Percentage
|
35.38%
|
36.02%
|
16.55%
|
| Swing
|
2.04%
|
3.46%
|
1.90%
|
|
|
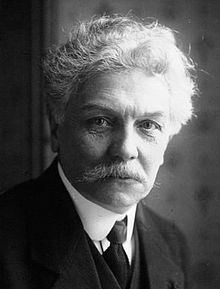 Prime Minister Henri Jaspar
General elections were held in Belgium on 26 May 1929.[1] The result was a victory for the Catholic Party, which won 71 of the 187 seats in the Chamber of Representatives.[2] Voter turnout was 94.0%.[3]
The incumbent Catholic-Liberal government led by Henri Jaspar continued after the election.
Results[edit]
Chamber of Representatives[edit]
| Party | Votes | % | Seats | +/– |
|---|
| Belgian Labour Party | 803,347 | 36.02 | 70 | –8 |
| Catholic Party | 788,914 | 35.38 | 71 | –7 |
| Liberal Party | 369,114 | 16.55 | 28 | +5 |
| Frontpartij | 132,567 | 5.94 | 11 | +5 |
| Christian Workers' Alliance | 52,642 | 2.36 | 5 | +5 |
| Communist Party of Belgium | 43,237 | 1.94 | 1 | –1 |
| Lille List | 12,905 | 0.58 | 1 | New |
| Christian People's Party | 8,049 | 0.36 | 0 | New |
| Communist Opposition | 6,190 | 0.28 | 0 | New |
| Neutral | 6,030 | 0.27 | 0 | 0 |
| Walloon National Party | 1,883 | 0.08 | 0 | 0 |
| Middle Class Party | 1,114 | 0.05 | 0 | 0 |
| Leftist dissidents | 1,047 | 0.05 | 0 | New |
| Flemish Liberal Democrats | 1,034 | 0.05 | 0 | New |
| Martin List | 954 | 0.04 | 0 | New |
| Radical Socialists | 402 | 0.02 | 0 | 0 |
| Lambreghs List | 366 | 0.02 | 0 | New |
| Catholic Democratic Union | 274 | 0.01 | 0 | New |
| Total | 2,230,069 | 100.00 | 187 | 0 |
|
| Valid votes | 2,230,069 | 95.03 | |
|---|
| Invalid/blank votes | 116,660 | 4.97 | |
|---|
| Total votes | 2,346,729 | 100.00 | |
|---|
| Registered voters/turnout | 2,497,446 | 93.97 | |
|---|
| Source: Belgian Elections, Mackie & Rose |
 |
|---|
| Party | Votes | % | Seats | +/– |
|---|
| Belgian Labour Party | 781,635 | 36.75 | 36 | –3 |
| Catholic Party | 762,459 | 35.85 | 38 | 0 |
| Liberal Party | 359,895 | 16.92 | 13 | 0 |
| Frontpartij | 119,632 | 5.62 | 3 | +3 |
| Christian Workers' Alliance | 55,237 | 2.60 | 3 | +3 |
| Communist Party of Belgium | 36,881 | 1.73 | 0 | 0 |
| Christian People's Party | 6,923 | 0.33 | 0 | New |
| Walloon National Party | 3,413 | 0.16 | 0 | 0 |
| Radical Socialists | 775 | 0.04 | 0 | 0 |
| Total | 2,126,850 | 100.00 | 93 | 0 |
|
| Valid votes | 2,126,850 | 92.81 | |
|---|
| Invalid/blank votes | 164,702 | 7.19 | |
|---|
| Total votes | 2,291,552 | 100.00 | |
|---|
| Registered voters/turnout | 2,439,060 | 93.95 | |
|---|
| Source: Belgian Elections |
References[edit]


.jpg)

