
Talk:Satellite temperature measurement/Archive 2
| This is an archive of past discussions. Do not edit the contents of this page. If you wish to start a new discussion or revive an old one, please do so on the current talk page. |
| Archive 1 | Archive 2 |
Strat cooling mostly from ozone?
Don't think I belive this [1] William M. Connolley (talk) 22:08, 15 February 2010 (UTC)
William, Shine et al. 2003[2] report this for the lower stratosphere: "At 100 hPa, the modelled cooling due to ozone depletion alone is in reasonable agreement with the observed cooling at all latitudes."
See also Randel 2008 [3] and the Thompson 2009 [4] paper which states: "Attribution experiments indicate that the long-term cooling in the global-mean lower-stratospheric temperatures is driven mainly by changes in stratospheric ozone (e.g.. Rosier and Shine 2000; Ramaswamy and Schwarzkopf 2002; Shine et al. 2003;Langematz et al. 2003;Ramaswamy et al. 2006)" --Giorgiogp2 (talk) 22:21, 15 February 2010 (UTC)
Science 2005 articles
Can anyone give more detail on this:
- Some believe that much of the disparity may have been resolved by the three papers in Science, 11 August 2005, which pointed out errors in the UAH 5.1 record and the radiosonde record in the tropics. —Preceding unsigned comment added by 118.93.48.179 (talk) 08:23, 28 February 2010 (UTC)
- Have you considered reading the papers? William M. Connolley (talk) 10:00, 28 February 2010 (UTC)
UAH 5.3
http://deepclimate.org/2010/03/08/a-first-look-at-uah-5-3/ is worth noting William M. Connolley (talk) 19:31, 9 March 2010 (UTC)
Article information seems to go well beyond its title
The sea surface temperature article has been revamped due to improvements made in the numerical weather prediction article. When doing a web search, I ran across this wikipedia article regarding satellite temperature measurements, so I started incorporating some of the SST article information into this article. After I noticed the article structure, I was initially confused. A cursory review of the article shows that its content goes well beyond its name. It looks strongly linked to the global warming/climate change articles, and even mentions information you would not expect to be involved in an article with this name. My question is: Should the article be renamed, Satellite temperature measurements (climate change), or should the information within the article be aligned with its current title? If so, the order of this article would need to be flipped, surface information/SST first (since that's where we all live and that information was first available via satellites, so it makes sense chronologically as well) with a decent amount of material eliminated since it goes beyond the scope of its title. Thoughts? Thegreatdr (talk) 22:21, 9 January 2011 (UTC)
- I, for one, wouldn't want to see this article ripped apart. Satellite measurements are a key portion of the climate change discussion, and as such the information here is useful (for the most part). In addition, the historical problems with satellite data (and to a degree their continuing limitations) have been an important part of the uncertainties surrounding climate change in both the scientific and public perceptions. Yes, the study of climate change is only one application of satellite temperature data, but it certainly one of the most important applications. That said, I can certainly see other things that would also fall under this topic heading. For example, a more detailed discussion of the technology and its history could be useful. Dragons flight (talk) 20:30, 11 January 2011 (UTC)
- I don't fully understand the proposal. What you suggest (qualifying "Satellite temperature measurements" with "climate change") suggests that there are other subtopics of comparable weight that merit their own articles (such as technology, other applications, etc.?) Where might those articles be? Until such independent articles appear would it not be better to keep this article as the main topic? - J. Johnson (JJ) (talk) 20:41, 12 January 2011 (UTC)
- I'm just trying to fix what appears to be an undue weight (and for that matter, a wikification) problem. I have no problem keeping global warming information within it, in its own subsection. But the order of content within the article seems illogical to me. It will require basic restructuring. The percentage of global warming information is going to drop. Some of the drop will be due to new content being added, the rest due to some restriction of content, though I'm not sure how much right now. Since the title of the article is what it is, other information (such as radiosonde-related information) generally doesn't belong here. I agree with Dragons flight about what information could be added, which would help resolve the issue. J. Johnson, there just might be room for subtopics here. Since the feedback is limited so far, I will not rename the article. Thanks for the input so far. Thegreatdr (talk) 13:54, 14 January 2011 (UTC)
- I don't fully understand the proposal. What you suggest (qualifying "Satellite temperature measurements" with "climate change") suggests that there are other subtopics of comparable weight that merit their own articles (such as technology, other applications, etc.?) Where might those articles be? Until such independent articles appear would it not be better to keep this article as the main topic? - J. Johnson (JJ) (talk) 20:41, 12 January 2011 (UTC)
If this article will not focus over climate change it is definitively necessary to create a new article with the old content (MSU temperature measurement?) because people clicking on links to this article expect to find a discussion about msu trends and uncertainty. Also it would be better to use a subpage to make massive changes, currently T2 trend discussion is under "surface measurement".--Giorgiogp2 (talk) 15:45, 14 January 2011 (UTC)
- The climate change articles should focus on climate change. This article is meant to be an overall treatment of satellite temperature measurements, not primarily a discussion on their impact on the global warming debate. The current structure is more evenly weighted than versions from previous days. Uncertainty is meant to be minimized within wikipedia articles, per the Manual of Style (MoS). If you want to create an article specifically talking about the evolution of certain datasets, create articles about those specific datasets, which can then be linked from this article through wikilinks. For example, the new article on the UAH satellite temperature dataset preserves much of the "lost content" from this page. There was a significant amount of information about that dataset formerly in this article, which is better treated within a subarticle specifically about that dataset. Other information not in the current version of this page still lies within the history of this page; no information has been lost, per se. Thegreatdr (talk) 16:24, 14 January 2011 (UTC)
New page created: http://en.wikipedia.org/wiki/MSU_temperature_measurements --Giorgiogp2 (talk) 16:21, 14 January 2011 (UTC)
Method of taking measurements
The lead has this: "Surface measurements are derived from skin temperature, determined by thermal infrared imagery of weather satellites."
Sounds like pictures are taken of the satellites - anyway I'll remove it unless anyone objects, I only haven't done yet as I don't know what it means by in this context 'skin temperature'. IanOfNorwich (talk) 23:20, 25 February 2011 (UTC)
- I just reverted two edits by IanOfNorwich. In the first, I feel that obtaining satellite temperature measurements from the sea surface and from the troposphere, makes more sense than his alternative of satellites making temperature measurements of the sea surface and the troposphere. In the second edit, IanOfNorwich says that satellite datasets show the "predicted effects of an increase of greenhouse gases" in the lede. The previous wording summarised the section 'Reconciliation with climate models' in the article, which is cited to the 3AR and 4AR of the IPCC, the United States Global Climate Change Research Program etc. If any changes are due here, first the referenced section needs challenging, either on the quality of its references, or that of our treatment of them. You can't change the meaning of the lede in isolation. --Nigelj (talk) 23:35, 25 February 2011 (UTC)
- Hi Nigelj, We're now talking about 3 things here so I'll break them down.
- 1. I changed
- "Satellite temperature measurements have been obtained from the sea surface since 1967 and from the troposphere since late 1978."
- to
- "Satellite temperature measurements of the sea surface have been made since 1967 and of the troposphere since late 1978."
- It's a question of accurate use of language - the measurements are made/obtained from obit; the radiation is from the sea surface/troposphere. I'm fairly ambivalent between made and obtained, I pondered some time on that when editing - you can certainly be said to make, take or obtain a measurement. My rationale was a) given the choice of a simple or fancy word choose the simpler. b) obtain suggests pre-existence; measurements don't exist until a person/instrument makes them.
- I agree there is a bit of clunkiness but I'd prefer a little clunkier and more accurate. Some of the clunkiness comes from trying to retain "Satellite temperature measurement" as the start of the sentence. Personally I'd prefer;
- "Satellite measurements of the sea surface temperature have been made since 1967, and measurements of the tropospheric temperature since late 1978."
- 2.I changed:
- "Satellite datasets show there has been warming in the troposphere over the past few decades, and cooling within the stratosphere, both of which are supported by global warming research."
- to
- "Satellite datasets show there has been warming in the troposphere over the past few decades, and cooling within the stratosphere, both of which are predicted effects of an increase of greenhouse gases in the atmosphere."
- Nigelj says that "The previous wording summarised the section 'Reconciliation with climate models'". Which has:
- "Climate models predict that as the surface warms, so should the global troposphere. Globally, the troposphere should warm about 1.2 times more than the surface; in the tropics, the troposphere should warm about 1.5 times more than the surface."
- It's a fair point to say that the lede should echo the content. I have a problem with observations being said to be supported by models! I realise that the data sets in question are themselves the product of models...perhaps something like:
- "Satellite datasets show there has been warming in the troposphere over the past few decades, and cooling within the stratosphere, which is in agreement with climate models."
- This has the problem that it makes me ask what climate models? But that is at least reflecting the content of the section below.
- 3. Surely this can be improved/removed: "Surface measurements are derived from skin temperature, determined by thermal infrared imagery of weather satellites."
- IanOfNorwich (talk) 09:09, 26 February 2011 (UTC)
- At risk of sounding like I'm talking to myself here, how about the following for the lede:
"The temperature of the atmosphere at various altitudes as well as sea and land surface temperatures can be infered from satellite measurements. Weather satellites do not measure temperature directly but measure radiances in various wavelength bands. These measurements can be used to locate weather fronts, monitor the El Niño-Southern Oscillation, determine the strength of tropical cyclones, study urban heat islands and monitor the global climate. Wildfires, volcanos, and industrial hot spots can also be found via thermal imaging from weather satellites.
Since 1978 Microwave sounding units (MSUs) on National Oceanic and Atmospheric Administration polar orbiting satellites have measured the intensity of upwelling microwave radiation from atmospheric oxygen, which is proportional to the temperature of broad vertical layers of the atmosphere. Measurements of infrared radiation pertaining to sea surface temperature have been collected since 1967.
Satellite datasets show there has been warming in the troposphere over the past four decades, and cooling within the stratosphere, both of which are in agreement with climate modeling of the increased levels of greenhouse gases in the atmosphere."
- It looses the article name but that's OK - WP:LEADSENTENCE. IanOfNorwich (talk) 21:38, 27 February 2011 (UTC)
- Small but important quibble: the sentence should read "...consistent with the influence of increasing concentrations of greenhouse gases" rather than "...in agreement with climate modeling of the increased levels of greenhouse gases." Modeling is not needed to infer that tropospheric warming and stratospheric cooling will result from increased greenhouse gases. This relationship is expected from very, very basic physical considerations that don't require mathematical modeling. Short Brigade Harvester Boris (talk) 01:18, 28 February 2011 (UTC)
- It looses the article name but that's OK - WP:LEADSENTENCE. IanOfNorwich (talk) 21:38, 27 February 2011 (UTC)
- I've edited the lede to the version above with Short Brigade Harvester Boris's amendment plus "..in the atmosphere."
- IanOfNorwich (talk) 10:39, 28 February 2011 (UTC)
Reconciliation with climate models
I've been trying to make the Reconciliation with climate models section a bit more coherent. It seems that just about all the differences between the satellite record and models it was talking about were that the sat. data doesn't show a slightly greater warming at TLT than the surface, as would be expected, and that this effect is most marked/only occurs in the tropics. I fear it's now a bit repetitive as I couldn't find a source for the 1.2 and 1.5 times the warming at the surface statements but could source an absolute difference 0.3deg C from CCSP SAP1.1, so added that.IanOfNorwich (talk) 09:36, 8 March 2011 (UTC)
I just moved the bit Giorgiogp2 added yesterday as I think it flows better there, hope this is OK. BTW, it says that some versions of the sat data show the amplification in the tropics - that's interesting - much better in so many ways though if we can say which ones? IanOfNorwich (talk) 09:43, 8 March 2011 (UTC)
UAH link to "UAH satellite temperature dataset"
I'd changed a link In this sentence "Among these groups are Remote Sensing Systems (RSS) and the University of Alabama in Huntsville (UAH)." to point to UAH satellite temperature dataset rather than University of Alabama in Huntsville. That was reverted by JJ.
I changed it because in the past when I first came to this article I was frustrated because when I clicked that link I got the general UAH wiki page which had and still has nothing on climate science at all and no link to any. This didn't help me. What I wanted (and I imagine most people clicking the link would want) was more information about the data set and/or the people compiling it. That is available now at the UAH satellite temperature dataset, which incidentally has a link to 'University of Alabama in Huntsville' for anyone interested in the general institution instead. --IanOfNorwich (talk) 22:07, 30 March 2011 (UTC)
- The sentence starts: "Among these groups...", which previously then referred the RSS and UAH groups. You redirected the second reference to a dataset, which is not a group.
- The second reference was problematical as it was, in that it is unlikely the entire UAH was working on this topic, and certainly the "group" should be identified more specifically. (Which would lead more closely to "the people" compiling the data.) But the dataset is not a group. My recommendation would be to do some research and identify the specific group at UAH, and refer to them. - J. Johnson (JJ) (talk) 20:23, 31 March 2011 (UTC)
- BTW, I see that the same edit (which I have also reverted) was made at Global warming by User:Simplex1swrhs. Is that you? - J. Johnson (JJ) (talk) 20:48, 31 March 2011 (UTC)
- Simplex1swrhs is certainly not me. I have only one account. I resent the suggestion that I have two accounts and would appreciate an apology. I assume that he made the edit for the same reason that I did - it is more useful that way. You can change the sentence to "Among these groups are Remote Sensing Systems (RSS) and the University of Alabama Huntsville Global Hydrology and Climate Center (UAH)" if you want but unless you also want to create an article for the "University of Alabama in Huntsville Global Hydrology and Climate Center" it won't help with this question. Wikilinks are not semantic tokens that change the meaning of a sentence. They just make it easier to quickly move around the encyclopedia and thereby understand one article in light of other connected ones.
- --IanOfNorwich (talk) 23:24, 31 March 2011 (UTC)
- Hey, cool down! I was just asking. And I don't really care much. I have a feeling Simplex is someone we know, but as long as he (she?) stays out of trouble I don't really care.
- I agree that wikilinks are not semantic tokens, but "groups", "UAH", and "dataset" are. And I think it is reasonable to require sentences to be syntactically correct in having agreement of semantic tokens. (Also that "UAH" should link to UAH, not a dataset.)
- But let's get past that. Please note: I sympathize with why you changed the link, and I agree it can (should) be improved. I am just saying that this "fix" isn't right. Allow me to make a suggestion: let's replace "UAH" with the particular group at UAH that produced the dataset. (Which I am pretty sure isn't "Global Hydrology and Climate Center" — that's NASA, right?) If they don't have a WP page, well, fine so be it. Or use an external link. (This should also be done at UAH satellite temperature dataset, which should certainly have more detail on who created it.) As to linking to the dataset article, well, you have that further down. Okay? - J. Johnson (JJ) (talk) 22:30, 1 April 2011 (UTC)
- According to this [5] the "Global Hydrology and Climate Center" is NASA but is at UAH. Just to be clear that we are on the same page, so to speak, I didn't change the text that appeared on the page only the destination of the link, right?--IanOfNorwich (talk) 18:21, 2 April 2011 (UTC)
- That's a start. I see that your link links "UAH" to a paper (grrrr) where Christy's affiliation is given as "ESSC/GHCC" at UAH; I gather that means Earth Systems Science Center. I didn't see any mention of satellite datasets (are they hiding??), but perhaps if you nose around a bit you might find something. - J. Johnson (JJ) (talk) 20:41, 2 April 2011 (UTC)
- Well, I've changed the wording. Personally I remain unconvinced that, in this context, linking "University of Alabama Huntsville" to their dataset was a problem, but at least it is still now easy to find further info on the topic, albeit at the cost of some clunkiness. --IanOfNorwich (talk) 19:51, 4 April 2011 (UTC)
- Much improved. Particularly the being prepared "at" UAH rather than "by" UAH. I could see being prepared "by GSCC at UAH", but they do seem to be shy about it. - J. Johnson (JJ) (talk) 21:25, 4 April 2011 (UTC)
- Well, I've changed the wording. Personally I remain unconvinced that, in this context, linking "University of Alabama Huntsville" to their dataset was a problem, but at least it is still now easy to find further info on the topic, albeit at the cost of some clunkiness. --IanOfNorwich (talk) 19:51, 4 April 2011 (UTC)
- That's a start. I see that your link links "UAH" to a paper (grrrr) where Christy's affiliation is given as "ESSC/GHCC" at UAH; I gather that means Earth Systems Science Center. I didn't see any mention of satellite datasets (are they hiding??), but perhaps if you nose around a bit you might find something. - J. Johnson (JJ) (talk) 20:41, 2 April 2011 (UTC)
- According to this [5] the "Global Hydrology and Climate Center" is NASA but is at UAH. Just to be clear that we are on the same page, so to speak, I didn't change the text that appeared on the page only the destination of the link, right?--IanOfNorwich (talk) 18:21, 2 April 2011 (UTC)
Ian: Just a suggestion, but your latest edit might be clearer with an insertion like "corrections are necessary for the satellite's orbital drift and decay." - J. Johnson (JJ) (talk) 18:57, 7 April 2011 (UTC)
Ian: your most recent edit seems okay in itself. But it did seem rather furtive, in that you did not mention what you were doing, and it is very similar to the matter previously in issue here. Perhaps you could provide a little more "heads up" in the future? - J. Johnson (JJ) (talk) 20:54, 7 August 2011 (UTC)
OK. Sorry, point taken.--IanOfNorwich (talk) 21:34, 7 August 2011 (UTC)
Update trends
Where did the data for the recent trend updates come from? The same sources as the previously? Then the access-dates should be updated. Otherwise it looks like they came out of thin air. Which I realize is more or less what the satellites do, but it should be documented. ~ J. Johnson (JJ) (talk) 21:18, 13 February 2012 (UTC)
Step Change?
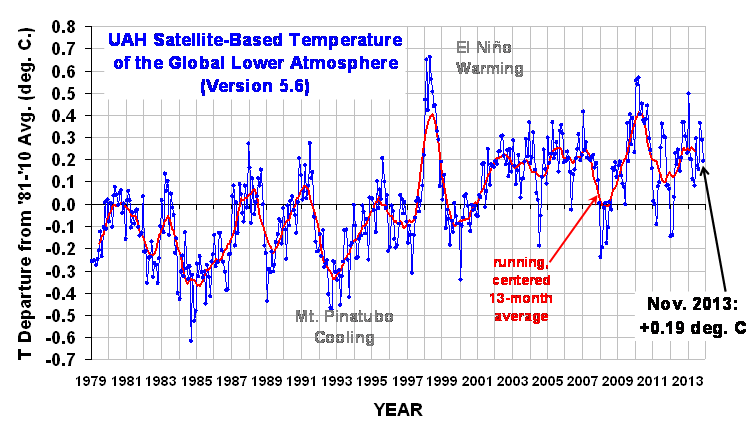
See here. Using the UAH and RSS data sets from 1980 to present, apply a linear trend analysis (similar to current chart image in the article). However run the linear trend from 1980 to 1997, then from 1998 to present. Reason -- because of the huge temperature spike attributed to the El Nino in 1998. If you do this, what jumps out of the data set is not a gradual 0.2C degree temperature increase by decade, but instead a huge step change jump. Do you all think this is a valid linear trend analysis compared to the current image linear trend? SunSw0rd (talk) 14:44, 6 February 2011 (UTC)
(Moved from own section to here):
It could be made a lot clearer exactly what the table in this section is supposed to show. It seems to purport to be the global decadal trend since Dec 1978 according to Christy et al. Is that with retrospective corrections or without?
Can anyone explain the jump in the values on the table in this section of the article
1997 0.040
1998 0.112
I know 1998 was hot but to to shift the trend over 20 years that much would take some doing!
IanOfNorwich (talk) 10:06, 26 February 2011 (UTC)
Having seen SunSw0rd's earlier comment on this and following his link, it looks like the table is accurate and the jump is due to the anomaly in 1998 divided by 20 year being large compared to the trend. This is in good agreement with the table although the site uses up-to a given year so all the years differ from the chart by 1.
So the table does seem to correctly illustrate its point. IanOfNorwich (talk) 10:55, 26 February 2011 (UTC)
While on the subject of this section, it would be nice to have a table of the most up to date RSS and UAH decadal trends for each of the channels, how about this:
| Channel | Start | End Date | RSS Global Trend (K/decade)[1] | UAH Global Trend (K/decade) |
|---|---|---|---|---|
| TLT | 1979 | 2011-01 | 0.163 | 0.140[2] |
| TMT | 1979 | 2011-01 | 0.099 | 0.052[3] |
| TTS | 1987 | 2011-01 | 0.008 | |
| TLS | 1979 | 2011-01 | -0.306 | -0.391[4] |
I was thinking to add something like this table to the MSU temperature measurements article. As a side note, to avoid confusion with the data in the article, RSS trends updated to version 3.3 are available over the graphs at the end of the page,those at the middle of the page are still the v3.2 trends:http://www.ssmi.com/msu/msu_data_description.html
Changes description:http://www.ssmi.com/msu/msu_data_description.html#version
tlt:+0.148
tmt:+0.091
tts:+0.001
--Giorgiogp2 (talk) 21:33, 27 February 2011 (UTC)
Thanks, Giorgiogp2, I was just beginning to scratch my head as I'd seen tlt:+0.148 on the graph there. I'll adjust and add it to the MSU article. I'm for adding it to this page also. If there's room for a list of historic trends of UAH T2LT then there should be room for this.
While on that subject I'd like to see the RSS data in that table as well. If you look at this the change is from about 0.8 to 0.15, which is a similarly sized jump but gives a slightly different impression. (Perhaps that is now different in v3.3?) I don't know if one data set is better than the other, they both seem worthwhile. I can't, however, find that data in that form. Anyone know where the UAH historic global trend averages come from? I can't find it in any nearby ref. IanOfNorwich (talk) 23:59, 27 February 2011 (UTC)
I looked to add it to the MSU article but the data is currently in the lead and nowhere obvious to put it (I won't put a table in the lede). It's too late for me to be restructuring articles right now so it's not there. I have, however, added it to the 'Trends from the record' section. There is room for a table of the latest trends in that section! IanOfNorwich (talk) 00:10, 28 February 2011 (UTC)
Now that it is 2013, go to the original link (here) and you will see the step change even more clearly. I belive this gives a much more accurate perspective of the actual data than does the current image. Also of interest is that the 2 satellite data sets diverge after the break in opposite directions regarding trend. SunSw0rd (talk) 16:19, 30 April 2013 (UTC)
- Note also that the step change break is seen clearly in the HadCRUT#HadCRUT3 (sea surface, not satellite) results here. I believe this confirms the logic of showing the trends pre and post break for 1998. SunSw0rd (talk) 16:29, 30 April 2013 (UTC)
- (edit conflict) Tamino had a good educational piece last year on how step changes can be both a better fit to the the data, but less significant than a linear trend. Essentially, the lower residuals are offset by the fact that there are more free parameters in the step model. In this particular case, the point of the graph is to show the match in the various surface and satellite records in terms of their overall trends, hence why a linear trend is computed for each. Sailsbystars (talk) 16:31, 30 April 2013 (UTC)
- Yes, I see the Tamino article. Of interest perhaps is that he concludes with: "The step-changes model has smaller residuals, but the two-straight-lines model has lower AIC (better model)." Note that his last chart has 2 linear trend lines (not one). He is comparing it to the multi-step line models and concludes that it is superior -- and that it may be for showing clarification. I concur the last chart is best. Note however he did not show a Malacca chart with a single linear trend line -- if he had, I would say the one shown with the 2 trend lines is better (more accurate). SunSw0rd (talk) 16:45, 30 April 2013 (UTC)
- (edit conflict) Tamino had a good educational piece last year on how step changes can be both a better fit to the the data, but less significant than a linear trend. Essentially, the lower residuals are offset by the fact that there are more free parameters in the step model. In this particular case, the point of the graph is to show the match in the various surface and satellite records in terms of their overall trends, hence why a linear trend is computed for each. Sailsbystars (talk) 16:31, 30 April 2013 (UTC)
See here for an update showing HadCRUT compared to RSS from 1987 to present. Again the break can be seen clearly and you can see why there have been media reports about the lack of warming for the past 15 years. SunSw0rd (talk) 12:06, 1 November 2013 (UTC)
Or see RSS MUS Lower Trop. Global Mean for the past 17 years. SunSw0rd (talk) 15:43, 4 November 2013 (UTC)
Comparison Between Satellite Data Sets and Computer Models
See here. How valid is this? SunSw0rd (talk) 19:39, 8 November 2013 (UTC)
- I can't reproduce it myself. I get that there was a dT of 0.5 C whereas Dr. Spencer's graph only shows an increase of 0.1 C. I note that he seems to be comparing only the 20S-20N latitudes, which I don't have an easy way of getting access to. Not sure the reason for why there's such a big change with an extra 20 deg of latitude, (I used 30S-30N) though, although the poles have been warming faster than the rest of the planet.... Sailsbystars (talk) 15:37, 9 November 2013 (UTC)
- I suspect that this is closer since it is both the UAH and RSS datasets (not HadCRUT). But he applied "squares" and I don't see how to do that with the Wood For Trees site. Also WFT only provides a data start of 1980 for the satellites even if you set it to 1978. SunSw0rd (talk) 03:08, 10 November 2013 (UTC)
Problem with UAH Data Graph and Current UAH / RSS Data Graph
See UAH Satellite-Based Temperature of the Global Lower Atmosphere (Version 5.6). Now compare to the graphic labelled "Surface and Satellite Temperatures" on the top right of the page (I don't include the link here because it makes a huge image, just click on current image on page to view). There is a discrepancy between the UAH record in the two graphics. Specifically the current graphic shows UAH (red) having many recorded results between +0.2 to +0.4 between 1980 and 1985. However the UAH graphic posted in the link I provided above shows no correlation to this and only exceeds +0.1 for a single data point in 1983. Looking back and forth between the graphics it appears the current Wikipedia graphic has shifted the UAH data upwards by approximately +0.3 for the years 1980 to 1985. What is the explanation? SunSw0rd (talk) 19:13, 20 December 2013 (UTC)
- You mean File:Satellite Temperatures.png? That and your fig don't have the same anomaly base William M. Connolley (talk) 20:21, 20 December 2013 (UTC)
- Yes I mean that. Both figures are referencing UAH so -- what is the specific basis for the difference? Since they are referencing UAH data sets -- are the data sets different? Also please note the link below the File:Satellite Temperatures.png figure (UAH 2003; data set tltglhmam version 5.2 with 2009 updates) is broken. What would be the correct link to the UAH anomaly base for the current image? SunSw0rd (talk) 01:04, 21 December 2013 (UTC)
I suggest that this RSS versus UAH graphic is more accurate than File:Satellite Temperatures.png because it correlates directly with File:Radiosonde_Satellite_Surface_Temperature.svg. The existing graphic lower down in the article File:Radiosonde_Satellite_Surface_Temperature.svg more accurately portrays the data specific to the article which is "Satellite temperature measurements". I recommend replacing File:Satellite Temperatures.png with File:Radiosonde_Satellite_Surface_Temperature.svg and then deleting File:Radiosonde_Satellite_Surface_Temperature.svg from its current location in the article. Comments? SunSw0rd (talk) 14:53, 4 January 2014 (UTC)
- You haven't understood what I said about different anomaly bases. Until you've worked that out, you've got no business discussing the accuracy of any of these pix William M. Connolley (talk) 17:55, 4 January 2014 (UTC)
Ambiguous
The article writes: "Climate model results summarized by the IPCC in their third assessment show overall good agreement with the satellite temperature record.". Is this a case of climate models being used to actually predict the data successfully (i.e. before it was measured), or a case of climate models successfully fitting over past data? J1812 (talk) 10:40, 17 January 2015 (UTC)
- See the funny-looking "[39]" coloured blue after that statement? Its what's called a "reference". You could, like, read it William M. Connolley (talk) 15:54, 17 January 2015 (UTC)
I would like to read their explanation as the RSS data to 2015 is not fit by any climate model as far as I am aware. But the link is broken so I guess the art. will have to be edited? How about this as being a bit more honest: "Although climate models initially agreed with the data they were tuned with, there was a gradual divergence between model projections and satellite measurements. This problem is not unexpected as no climate model has ever passed hindcasting tests". — Preceding unsigned comment added by 137.222.249.189 (talk) 23:00, 11 February 2015 (UTC)
External links modified
Hello fellow Wikipedians,
I have just added archive links to one external link on Satellite temperature measurements. Please take a moment to review my edit. If necessary, add {{cbignore}} after the link to keep me from modifying it. Alternatively, you can add {{nobots|deny=InternetArchiveBot}} to keep me off the page altogether. I made the following changes:
- Added archive https://web.archive.org/20131016100839/http://www.ssmi.com/msu/img/msu_weighting_functions.png to http://www.ssmi.com/msu/img/msu_weighting_functions.png
When you have finished reviewing my changes, please set the checked parameter below to true to let others know.
This message was posted before February 2018. After February 2018, "External links modified" talk page sections are no longer generated or monitored by InternetArchiveBot. No special action is required regarding these talk page notices, other than regular verification using the archive tool instructions below. Editors have permission to delete these "External links modified" talk page sections if they want to de-clutter talk pages, but see the RfC before doing mass systematic removals. This message is updated dynamically through the template {{source check}} (last update: 18 January 2022).
- If you have discovered URLs which were erroneously considered dead by the bot, you can report them with this tool.
- If you found an error with any archives or the URLs themselves, you can fix them with this tool.
Cheers. —cyberbot IITalk to my owner:Online 04:49, 28 August 2015 (UTC)
Update
For some reason - despite the tremendous popularity of global warming discussion - no-one has updated the UAH-RSS comparison graphics for five years. For five years! There are people who probably stalk here and comment me in mere seconds, yet the graph is that old. --84.250.122.35 (talk) 14:53, 29 August 2015 (UTC)
- That's part and parcel of a volunteer project. Why not update the graph yourself? Short Brigade Harvester Boris (talk) 14:58, 29 August 2015 (UTC)
- In principle. In real life, I'd just end up seeing my work being reverted. Climate change touching articles have too many people making sure I'm not stepping on their feet in a wrong way. Thanks for suggesting, though. I'm hoping some of the activists would update the page. --84.250.122.35 (talk) 15:44, 29 August 2015 (UTC)
Outdated template
I've added the "out of date" template to this article. If someone updates the chart and regression, I would be delighted to see it removed. CometEncke (talk) 18:19, 16 January 2016 (UTC)
- This is "the encyclopedia that anyone can edit," so you're quite welcome to update it yourself. You don't need to make a request. Shock Brigade Harvester Boris (talk) 00:44, 17 January 2016 (UTC)
What does this mean?
"Climate model results summarized by the IPCC in their third assessment show overall good agreement with the satellite temperature record. In particular both models and satellite record show a global average warming trend for the troposphere (models range for TLT/T2LT 0.6 - 0.39 °C/decade; avg 0.2 °C/decade) and a cooling of the stratosphere (models range for TLS/T4 -0.7 - 0.08 °C/decade; avg -0.25 °C/decade).[41]"
- 0.6 - 0.39 °C/decade ??? Why is first number larger than second? Surely shouldn't be that high?
- average of 0.2, is that average in the range?
- Sourced to a 2006 document seems a bit outdated.
- Can't find an instance of 0.6 or 0.39 in the reference.
Is that enough problems to convince editors that this could do with a rewrite by someone who understands this stuff? crandles (talk) 01:26, 22 January 2016 (UTC)
"inconsistency among these model results and observations at the global scale"
@William M. Connolley: the statement you reverted back into the article is based on a citation from a 2006 publication[5] which was pre IPCC AR4 and AR5 and is way out of date. In the description of my edit removing the invalid statement based on this old cite, I cited a February 2016 peer-reviewed article from Nature Climate Change,[6] which explains the clear and well-known discrepancies between CMIP5 model runs and both the terrestrial and satellite datasets. Unless you have some other justification for your revert of my edit, I will change it back, and in the future please read what is written in the edit description before making reverts. --TheClarinetGuy talk 22:37, 3 February 2017 (UTC)
I will wait another day and then take your lack of response as consensus on this. --TheClarinetGuy talk 15:41, 4 February 2017 (UTC)
References
- ^ "RSS / MSU and AMSU Data / Description". Retrieved 26 February 2011.
- ^ "MONTHLY MEANS OF LOWER TROPOSPHERE LT5.4". UAH. Retrieved 26 February 2011.
- ^ "MONTHLY MEANS OF MID-TROPOSPHERE MT5.4". UAH. Retrieved 26 February 2011.
- ^ "MONTHLY MEANS OF LOWER STRATOSPHERE LS5.4". UAH. Retrieved 26 February 2011.
- ^ Tom M. L. Wigley; V. Ramaswamy; J. R. Christy; J. R. Lanzante; C. A. Mears; B. D. Santer; C. K. Folland (2 May 2006). "Executive Summary: Temperature Trends in the Lower Atmosphere - Understanding and Reconciling Differences" (PDF). United States Global Climate Change Research Program. Retrieved 26 April 2015.
- ^ Fyfe; et al. (24 February 2016). "Making sense of the early-2000s warming slowdown". Nature Climate Change. 6: 224–228. doi:10.1038/nclimate2938. Retrieved 3 February 2017.
{{cite journal}}: Explicit use of et al. in:|last1=(help)
New satellite graph and caption
@Giorgiogp2: The new graph you added is problematic. First, the metadata does not match the graph which apparently runs from 1975 through 2016, but it says 1981-2010. It doesn't show any trend data, so it is a jumble of lines that doesn't tell the reader anything visually. Third, why does it show RSS TTT twice instead of RSS TLT once and RSS TTT once? Fourth, it uses UAH beta5 data instead of the current UAH 6.0 release data. Fifth, who created the graph? Sixth, how was the averaging of the surface datasets done? Your source for the RSS lower troposphere data appears to be the NOAA website and not the original RSS data. The TLT data is version 3.3 not 4.0. And I'm sure there are several more problems that I haven't noted here after my brief peek at it. Finally, I am in the process of creating what I believe will be a much better graph for the Global warming page, including surface, satellite, and radiosonde representatives that I think would also better serve the purpose here, so I would request that you wait on that and see what you think. --TheClarinetGuy talk 06:53, 6 February 2017 (UTC)
- 1981-2010 is the reference period. (wrt-> with respect to).
- trend data are in the article or a box plot can be added, too many lines on a single plot makes it confusing.
- UW RSS is another dataset, the remote sensing system says the tlt has a known cooling bias, there will be tlt once a new version is available .http://images.remss.com/papers/rsstech/Jan_5_2017_news_release.pdf
- uah is version6, it's written in the graph to (?)
- average: https://en.wikipedia.org/wiki/Arithmetic_mean
- again there is no TLTv4.0 at the moment; the noaa page is a different dataset, the university of washington(UW) applies a different correction to remove stratospheric influence from the rss and uah dataset. It is clearly described into the webpage and in this article too.
https://www.ncdc.noaa.gov/temp-and-precip/msu/overview Giorgiogp2 (talk) 08:10, 6 February 2017 (UTC)
- @Giorgiogp2: Thank you for your responses.
- Understood. But it is confusing to have the surface data shown from 1975 while all others are shown from 1979. And trend lines and values are really needed to make some quick sense of a complex graph like this. As your graph shows, there is very little difference between the 4 ground sets either in anomalies or trends, so one or two of those is enough. I was planning to include simply the two most cited ones, GISS and HadCRUT4, along with RSS & UAH TLT latest versions, and RATPAC-A latest published version.
- My graph will have 5 datasets like yours but will represent all three of the major types of global warming data available—ground, satellite, and radiosonde—which is more balanced.
- Yes, I am aware of the RSS press release from a few weeks ago, but that doesn't change the fact that the current release of RSS TLT is what it is, and it is the widely cited and long published data. What you have published is new, not cited in WP:SECONDARY or other sources on any significant basis and therefore is WP:UNDUE.
- The data file link address for UAH in the metadata presently gives this outdated beta5 version. The correct current version is of UAH 6.0 is here.
- Question - were annual J-D averages of each year for each set taken first and then the J-D averages of the four sets then taken?
- Using a much less frequently cited, and indeed disputed, modified version of the data from NOAA which is based on one single disputed study from 13 years ago[1] is WP:UNDUE. The actual widely cited data from the original data provider is a much more reliable source.
- --TheClarinetGuy talk 13:40, 6 February 2017 (UTC)
References
- ^ Fu; et al. (6 May 2004). "Contribution of stratospheric cooling to satellite-inferred tropospheric trends". Letter to Nature. 429: 55–58. doi:10.1038/nature02524. Retrieved 6 February 2017.
{{cite journal}}: Explicit use of et al. in:|last1=(help)
1 and 2 Why? the previous graph too started from 1975. This ultimately is an article about satellite and it should focus on that, i wanted to emphasize satellite data and spread over the surface temperature. Trends can be plotted this way with uncertain bar: http://s17.postimg.org/ggmd032un/temperature_trends_comparison.png or better with a box plot if an ensemble is available (as far as i know rss and hadcrut provide this).
3 If the provider of the data tells me that there is a bias and they are working on a new version it doesn't make sense to plot the bad data just because it's widely used, i rather wait for the new version.
4 I will correct it but data are nearly identical except for 3 months that differ by 0.01.
5 yes but doesn't make any difference.
6 noaa is a reliable source and the methodology to derive the TTT channel doesn't have to change from 13 years ago, the linear combination of tmt and tls is still valid today, the original dataset does change and so the uwuah and uwrss timeseries.Giorgiogp2 (talk) 14:54, 6 February 2017 (UTC)
- It doesn't matter what the previous graph did. The point is, whatever is there should report data over a consistent period of time for all datasets so that they can be compared. Having one set of a different length conveys no additional information and indeed misrepresents the data. It implies that the ground set only goes to 1975. Why the arbitrary date? As it says in WP:GRAPHS, "Graphs must be accurate and convey information efficiently."
- If you want to emphasize satellite measurements, which makes sense, then there is no need for the ground data here in any case. Furthermore, the appropriate channel is the TLT channel as it is the part of the troposphere most affected by global warming. This should be an apples to apples comparison. Currently, it is a mish-mash of different types of data, from unreliable sources, with different lengths and so on.
- If and when there is a new release, that data should be used. The current release is the current release. There are biases and problems with all the data sets all the time. What you are doing here is picking and choosing winners and losers here. The current releases of the data sets is the clear best choice.
- Thanks. Yes, I'm not saying there was any major difference in the numbers, just that we should be citing the most recent releases of all the data.
- Thanks. Yes, I just wanted to understand.
- No NOAA is not a reliable source for RSS data. RSS data should come from RSS. See WP:RS. The source you chose is based on an isolated study as I have already pointed out. Clearly, the best source for RSS data is RSS.
- In any case, I will update this once I have a good graph ready. --TheClarinetGuy talk 19:03, 6 February 2017 (UTC)
FYI Wikipedia:How_to_create_charts_for_Wikipedia_articles NewsAndEventsGuy (talk) 13:05, 7 February 2017 (UTC)