
Talk:Pitch drop experiment
| This article is rated C-class on Wikipedia's content assessment scale. It is of interest to the following WikiProjects: | |||||||||||||||||
| |||||||||||||||||
.jpg)
Why?[edit]
As far as I can see, this article never explains the point of the experiment. What did Parnell hope to learn? The viscosity? The drop frequency should be well determined by now after eight drops, and the viscosity of the pitch has apparently already been estimated from that. Were there other goals that have not yet not been achieved? Just higher precision? Is the experiment continued for any scientific reason, or simply because of its curiosity value? --mglg(talk) 21:28, 13 September 2006 (UTC)
- From the university web information it seems that the "experiment" was never actually intended as a scientific measurement but simply as a demonstration, for teaching purposes, that some apparently solid materials do behave like high-viscosity fluids. I added a phrase to this effect. --mglg(talk) 21:49, 13 September 2006 (UTC)
- Experiments don't always need a point? It is wonderful and thought provoking! Just think of the things that have happened in the world and its still dripping.--Screen42 23:47, 21 February 2007 (UTC)
Why not? Femto 13:29, 22 February 2007 (UTC)
- "simply because of its curiosity value?": isn't this the fundamental cause of any scientific experiment or demonstration? Of any investigation that starts by asking "why does this...?" What better reason do we need? If humans were not motivated by curiosity, we would be sitting in caves eating raw mammoth... (in hindsight this perhaps may have been the better path (but that is a discussion for another forum)). — Preceding unsigned comment added by 80.254.148.123 (talk) 14:06, 3 July 2014 (UTC)
Now have a reply from University of Queensland[edit]
I just recieved the reply to my request above for permission:
- Your recent message to UQ Physics found its way to me, as the Custodian of the Pitch Drop Experiment. There is no way in which I would want to see the present image deleted from the Wikipedia page. So long as the indicated acknowledgment is given, I am happy for that image to be 'used' by anyone with a legitimate interest in the experiment. Would you therefore please spell out for me now the form of words that need to be used to ensure that the image remains on the Wikipedia page, and then will continue to be available for use by interested persons.
- John Mainstone
- Professor J S Mainstone OAM
- School of Physical Sciences : Physics
- The University of Queensland Q 4072
- and
- Adjunct Professor, ACU National
I will now consult the forms or maybe one of you could help me if it is too confusing. I want to see if we can get this permission business straightened out.--Filll 21:10, 19 December 2006 (UTC)
Ok now I have looked at the page on Wikipedia about permission. It is not at all clear to me what we need to do now. What next?--Filll 21:14, 19 December 2006 (UTC)
- Seeing as both pictures are from Commons, I have removed the photo request tag. Kevin 01:43, 20 June 2007 (UTC)
- That poor professor, I'm currently harrassing him about the commons pictures too. The pics on the Commons might get erased soon, in which case I'll re-upload my copies to English wikipedia alone. WLU 11:30, 20 June 2007 (UTC)
I thought I should post this here before making alterations, but the pictures says it was in year 2 of the 7th drop, but the chart says it was 2 years after the 7th drop. This makes it 2 years into the 8th. —Preceding unsigned comment added by 209.177.199.169 (talk) 13:26, 1 October 2008 (UTC)
Parallel Experiments[edit]
Around 1976 the University of St Andrews (Fife, Scotland) had a similar experiment that had been running for several decades. I'm afraid I don't remember the actual start date, but it may well have rivalled or preceded that of the University of Queensland's. As this experiment is very simple to set up and maintain, I suspect that other academic institutions may also have one running, hidden away somewhere and likely forgotten.40.0.96.1 (talk) 11:13, 23 November 2007 (UTC)
- Need a reliable source to add anything to the page. WLU (talk) 11:58, 23 November 2007 (UTC)
- just a quick googling: http://everything2.com/title/pitch%2520drop%2520experiment Twipley (talk) 16:13, 7 March 2009 (UTC)
- Ha! Thanks for finding documented confirmation of my 30-year-old memories, Twipley. I did search for corroboration back in 2007, but failed. 87.81.230.195 (talk) 02:42, 27 April 2009 (UTC) (formerly posting from 40.0.96.1)
- Here's another source for the St. Andrews experiment, a University of Queensland press release from 1999 https://www.uq.edu.au/news/article/1999/02/experiment-reaches-delicate-pitch . (I also saw the St. Andrews experiment with my own eyes in the 2000s.) RW Dutton (talk) 18:12, 6 May 2022 (UTC)
- just a quick googling: http://everything2.com/title/pitch%2520drop%2520experiment Twipley (talk) 16:13, 7 March 2009 (UTC)
Lord Kelvin started a 'pitch glacier' experiment in around 1887 at Glasgow University. As far as I know it is still going. I last saw it about 30 years ago at the university. There is a photograph of it in 'Kelvin's Instruments and the Kelvin Museum' by George Green and John T. Lloyd, published by the University of Glasgow (SBN 85261 016 5). Sibak (talk) 15:52, 19 September 2009 (UTC)
9th drop?[edit]
I was just watching the video stream, and comparing it with the picture in the article that is from 2007, I saw that it looks quite like the 9th drop might have fallen. Do I err here? --DocBrown (talk) 19:28, 12 March 2009 (UTC)
- Please compare:
- http://www.physics.uq.edu.au/physics_museum/pitch2.gif
- (Zoom in - it's right after the 6th drop fell in 1979.)
- and
- http://pitchdrop.physics.uq.edu.au:8081/flash.html
- (The most exiting webcam in the world: way better than watching paint dry.)
- From this we can see that the webcam is not showing a drop right after dropping.
- Now look at this:
- https://upload.wikimedia.org/wikipedia/commons/6/62/University_of_Queensland_Pitch_drop_experiment-6-2.jpg
- I have zoomed in and I can't find the drop I see on the webcam.
- If anyone from the University of Queensland is reading this, can you take a picture from the exact same angle as the 2007 picture and upload it? --Guy Macon (talk) 03:38, 27 May 2012 (UTC)
- I'll do it. btw I don't think the 9th drop has fallen...--Jsjsjs1111 (talk) 18:23, 27 May 2012 (UTC)
- Wow! Someone who can go over and watch the pitch dropping anytime they want! I don't know how you manage to contain the excitement... (smile)
- Seriously, though, it is pretty obvious that, right before a drop falls, it goes through a period where it is very fragile - any side-to-side force would snap it early. The 1979 photo right after the 6th drop fell looks like it got snapped off. the 2007 picture looks like it separated naturally.
- Regarding side-to-side forces, Clearly wind cannot get to it inside that (Cover? Bell jar?) but can the case be moved with a nudge, or is it bolted to the floor or wall? If you put your hand on the glass, can you feel any vibration from nearby machinery, traffic on a nearby highway, etc.? Is Queensland prone to earth tremors? can someone mucking about with the webcam shake that shelf it is sitting on?

- I've uploaded it. Taken with an old cheap camera, the quality wasn't very good...
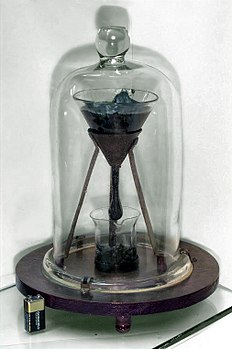
- The case is in a glass cabinet, as you can see in this picture. Moreover it's bolted to a piece of glass, thus no one can move or shake it.
- There isn't much traffic (well, except for the buses) nearby and I didn't feel anything when touching the glass cover outside. Queensland is not prone to earthquake at all, but prone to flood; I'm sure that last year's flood had no effect on it.
- The support legs look pretty rusty, however, I don't know whether they have been replaced or not.
- Hope this helps :)--Jsjsjs1111 (talk) 14:34, 13 June 2012 (UTC)
- 2007 and 2012: A comparison
-
 The Pitch in 2007
 -
 The Pitch in 2012

Quality is fine for comparing drop positions. Looks like you were off by 180 degrees and a little low, but it can clearly be seen that that, other than the drop being a bit lower, they are the same. --Guy Macon (talk) 15:32, 13 June 2012 (UTC)
- It's coming up on twelve years since the last drop. We must be due another one soon. Does anyone know of any predictions of when this might occur, based on the state of the hanging drop? Are people at the University making bets with each other about when it will be? If anyone knows the answers to these questions, has any more information or has spotted any media coverage as the next drop approaches, it would be good to see it added to the article. Credulity (talk) 15:47, 30 July 2012 (UTC)
- It took 12.3 years for the 8th drop to fall, and part of that time it was subjected to summer temperatures without air conditioning. (before air conditioning the drops took from 7.2 to 9.3 years to drop). We are 11.7 years into the 9th drop. Does anyone at the University of Queensland know when the air conditioning was installed? I would expect that your accounting department knows when they paid for it.
- Before the drop drops you should see the neck become a lot thinner. We could make it drop today by unbolting the experiment and shaking or bumping it -- that neck is brittle and the drop hanging at the bottom is a long lever. If, as has been reported here, it is not being bumped or vibrated, the neck could get quite thin before snapping. How thin? Nobody knows because nobody has seen one actually drop. The webcam should catch the next one if it doesn't fail at just the wrong time.
Oldest experiments.[edit]
Another experiment that predates this one: http://www.npr.org/2012/11/23/165030844/experiments-that-keep-going-and-going-and-going — Preceding unsigned comment added by 74.196.129.90 (talk) 02:09, 25 November 2012 (UTC)
- I did some improvements to William James Beal and added a link to that page. I don't know whether Beal's experiment meets the criteria for inclusion in the Guinness Book of Records. (Does anyone have an online source I can cite for Guinness Records?) --Guy Macon (talk) 08:46, 25 November 2012 (UTC)
Recent Edits[edit]
I noticed that User:Ansgarjohn added some content which User:Wdanwatts deleted without any edit comment. Ansgarjohn, please read WP:V; added material needs to be sourced. Wdanwatts, please read WP:BRD and WP:TALKDONTREVERT. You need to as a bare minimum give a reason for your revert in the edit summary and, if the revert is likely to be challenged, it is usually a good idea to explain your reasoning on the article talk page. --Guy Macon (talk) 15:10, 15 April 2013 (UTC)
battery[edit]
Would anyone care to speculate as to why there is a 9V battery in the lower left corner of the image of the experiment? 168.140.181.4 (talk) 06:22, 13 June 2013 (UTC)
- For scale? We wouldn't want anyone to think maybe the experiment is 20 stories tall or something that would fit under a thimble... --Guy Macon (talk) 23:46, 13 June 2013 (UTC)
Controversy?[edit]
Right now the page reads:
- "In May 2013 the experiment was moved to a temporary location. This caused some critics[who?] to question the integrity of the experiment with this movement coming at a time when the next drop is imminent.[citation needed]"
Who are these critics and what, exactly, were the criticisms? Surely the editor who added the above passage heard it somewhere...
http://smp.uq.edu.au/content/pitch-drop-experiment says:
- Due to plans for the refurbishment of the historic Parnell Building affecting the site of the Pitch Drop Experiment, scheduled to begin today (Tuesday, 28 May 2013), the experiment has been moved to a temporary location until mid-July. The live view is still available (as seen below), from the experiment’s temporary location.
I personally would question leaving it where it was in the middle of major construction. Of course there was a risk that jostling it might cause it to snap off (thus confirming the "never drops when a person or webcam is watching" jinx), but it clearly did not.
If anyone from the University is reading this, could you please check local sources (local newspaper, campus newspaper) for info on this? I would love to see a story detailing how they moved it. Have one person hand-carry it and hope he/she doesn't trip? I have done a fair amount of work in the aerospace industry, and we use special carts with huge soft tires and a mechanism that floats the item on a cushion of air rather than touching the cart.
Another interesting question is whether they are going to move it back later when the risk is greater and there is no compelling danger where it is, or whether they are going to wait until the next drop before moving it back.
Another question that someone from the university can answer: those two webcams go to separate computers running on separate uninterruptible power supplies, right? And they save the info to two solid-state disks, right? And you have dual lighting on uninterruptible power supplies so that if there is a power outage you don't have two working webcams recording a pitch black (note pun) room, right? And all of this gets tested on a regular schedule, right? Don't make me fly all the way to Australia just so I can slap you, M'kay? --Guy Macon (talk) 03:30, 14 June 2013 (UTC)
- You forgot about redundant Internet access so that we all can see this event live. Wsw70 (talk) 16:03, 18 July 2013 (UTC)
- I predict that there will be media reports and a sudden surge of interest shortly before the next drop, thus crashing their web server. I would really like to see a response to my comments above from the University rather than being able to say "I told you so." --Guy Macon (talk) 18:15, 18 July 2013 (UTC)
- What does this have to do with improving the article? - Shiftchange (talk) 00:49, 19 July 2013 (UTC)
- The university clearly has some amount of redundancy, as evidenced by the triple webcams. If we could find a reliable source that describes the redundancy steps taken it would make a nice addition to the article. I have done an extensive web search and have failed to find any sources at all on this. Someone in Australia might be able to find a source. We have had previous questions answered by university staff and students. --Guy Macon (talk) 02:28, 19 July 2013 (UTC)
PLEASE STOP![edit]
If you came here to edit this page because you read somewhere that there was a drop on 18 July 2013, please go back, read it again, and ask yourself the following two questions:
Is this Wikipedia article about the pitch drop at the University of Queensland in Brisbane, Australia which started in 1927, or is it about the pitch drop at Trinity College in Dublin, Ireland which started in 1944?
Is the web site where you read about this talking about the pitch drop at Trinity College in Dublin or is it talking about the pitch drop at the University of Queensland in Brisbane?
I hope this helps... --Guy Macon (talk) 12:55, 19 July 2013 (UTC)
- I went there yesterday and confirmed that nothing dropped.--Jsjsjs1111 (talk) 01:56, 20 July 2013 (UTC)
- This article can talk about both experiments. The Trinity College one just needs its own section. - Shiftchange (talk) 03:20, 20 July 2013 (UTC)
Definition of "drop"[edit]
The article doesn't define that. Is it when it hits the surface below, or when it detaches or what? Anna Frodesiak (talk) 15:04, 18 April 2014 (UTC)
- I think that we should be bold and decide that for our purposes it drops when it detaches. http://www.newscientist.com/article/dn25441-longest-experiment-sees-pitch-drop-after-84year-wait.html seems to be using the definition "whenever it touches one of the other drops in the beaker" no matter how high or low that previous drop is. This reminds me of the many announcements that "the sequencing of the human genome is complete" (at 90%, 95%, 98%, 99.% etc.) --Guy Macon (talk) 01:09, 19 April 2014 (UTC)
- Good call. Another way to approach this would be to use a "whenever a reliable source says it fell" definition, which is problematical. New Scientist magazine is certainly a reliable secondary source for reporting what we can all see at the reliable primary source (the live webcam feed), but are they a reliable source for defining what "dropped" means? I think not. As was the case with the human genome project, journalistic sources have a tendency to pick a definition that allows them to "scoop" other journalistic sources. There is a third option, which would be to wait until the University of Queensland makes an announcement. I would consider the UoQ to be a reliable primary source for both the definition and date time of a ninth drop. Given the slow sped of the experiment and the conflicting definitions of when a drop happens, maybe we should just report month and year in the tables. Does anyone really care whether a drop happened on the 10th day of a month or on the 20th?
- Is there any way we can tighten up the 1930 start time so that we can list a month as well as a year?
- http://smp.uq.edu.au/content/pitch-drop-experiment says "In 1927 Professor Parnell heated a sample of pitch and poured it into a glass funnel with a sealed stem. Three years were allowed for the pitch to settle, and in 1930 the sealed stem was cut".
- http://oldsite.smp.uq.edu.au/pitch/pitchPaper.shtml (PDF at http://shadow.eas.gatech.edu/~dufek/Geofluids/Assignments_files/pitch_drop_experiment.pdf) says "...set up in 1927 ... The pitch was warmed and poured into a glass funnel, with the bottom of the steam sealed. Three years were allowed for the pitch to consolidate, and in 1930 the sealed stem was cut" with a photo showing "1930 pitch poured in funnel", but it also says "...the volume of pitch that flowed through in the 582 months (approximately) from (about October) 1930 to April 1979 was obtained..."
- Based upon the above, I am going to add the month to the 1930 entry and remove the day from the 2000 entry. I think the current "17 April 2014 9th drop touched 8th drop" is fine until we can replace it with the date it actually drops.
- I can confirm that UQ does NOT called it "dropped".--Jsjsjs1111 (talk) 00:44, 20 April 2014 (UTC)
- We could even decide to remove the "17" from the 2014 entry: I doubt that at the slow pace of the process we can really be certain it did not happen on the 16th or so. A real drop (detachment from the funnel) is a discrete event, but how would we know when a liquid that is terribly slowly approaching some surface actually touches it? YewBowman (talk) 10:59, 21 April 2014 (UTC)
- Wouldn't they have some sort of electric current thingy making a connection to know the exact moment? Also, as drops accumulate, doesn't the distance between the original surface and the accumulating pile of drops skew the intervals? Anna Frodesiak (talk) 14:16, 21 April 2014 (UTC)
- The second question is easy: yes, under any definition of "drop". For "first touch" the problem is obvious, but even for "stem breaks", partially supporting the drop delays the break. The obvious solution would be to empty the jar every decade or so. Or they could rebuild the rig so that the funnel is higher -- but then the conditions change in a way that shortens the time to the next drop. None of these changes would come anywhere close to the change that happened when the college was air conditioned. I think that I should be given the task of setting up five new funnels in temperature chambers set at 0, 25, 50, 75, and 100 degrees C, and of course this would require a huge government grant to "support my research" (smile)...
- The good news is that, unlike ambient temperature, what happens at the bottom of the drop doesn't change the rate of flow in the neck of the funnel. If one interval is shortened, the next one is lengthened. This means that there is no real benefit to determining when, exactly one drop hits the next. Also, pitch is very good insulator. If someone at the UoQ is interested, I could easily design a meter for them that measures when the drops touch using capacitance or ultrasonic sensing, but I don't really see that as being worth doing.
- When it comes to mechanical engineering, I am about as useless as most electronics engineers, but here is my guess: The pitch right below the exit exerts it's full weight on the column in the funnel. As you move down, the weight starts splitting it's pull between pulling the bottom of the funnel down and pulling the sides of the stem inward, and by the time you reach the bottom of the drop, most of the force is acting on making the stem thinner. Meanwhile, the bottom of the drop is not resting on a fixed surface, but rather on a previous drop that is itself still flowing downward. Meanwhile, surface tension is fighting gravity.
- BTW, you might want to take a look at WP:INTERSPERSE. --Guy Macon (talk) 22:36, 21 April 2014 (UTC)
- Thank you both for the thoughtful responses. Sorry to have started something that isn't about improving the article. I thought that it might end up clarifying things within the article, though. Feel free to make a section header at the top of this if you like. Anna Frodesiak (talk) 22:43, 21 April 2014 (UTC)
Why not earlier?[edit]
The article says "The eighth drop fell on 28 November 2000, allowing experimenters to calculate that the pitch has a viscosity approximately 230 billion (2.3×10¹¹) times that of water". Why it was not possible to calculate earlier?--RicHard-59 (talk) 20:48, 22 April 2014 (UTC)
Infographic for Queensland Experiment - Bar Chart of Duration in Months[edit]
I propose the following bar chart to display the duration of each drop in the Queensland experiment. This infographic could replace the existing line graph or be added below it on the page. The table should stay as is. I vote for taking the place of the line graph on the page. I find the line chart difficult to read when at a smaller scale, but your experience may differ from mine. Also, using a discrete function (bars) instead of a continuous function (lines between points) is more appropriate for this kind of data. Do you agree this clearly graphs the data? Comments welcome. -- DutchTreat (talk) 13:11, 18 October 2014 (UTC)
| Drop | Months (Year Month) |
|---|---|
| Drop 1 | 98(1938 Dec)
|
| Drop 2 | 99(1947 Feb)
|
| Drop 3 | 86(1954 Apr)
|
| Drop 4 | 97(1962 May)
|
| Drop 5 | 99(1970 Aug)
|
| Drop 6 | 104(1979 Apr)
|
| Drop 7 | 111(1988 Jul)
|
| Drop 8 | 148(2000 Nov)
|
| Drop 9 | 156(2014 Apr)
|
- I agree that a bar chart is more appropriate than a line chart. I'd suggest a few minor changes though, like below. — HHHIPPO 17:45, 18 October 2014 (UTC)
| Drop | Months (falling date) |
|---|---|
| #1 | 98(Dec 1938)
|
| #2 | 99(Feb 1947)
|
| #3 | 86(Apr 1954)
|
| #4 | 97(May 1962)
|
| #5 | 99(Aug 1970)
|
| #6 | 104(Apr 1979)
|
| #7 | 111(Jul 1988)
|
| #8 | 148(Nov 2000)
|
| #9 | 156(Apr 2014)
|
- Agreed - looks good! Could this be integrated in the Timeline table? YewBowman (talk) 19:48, 18 October 2014 (UTC)
- Good idea! How about this? — HHHIPPO 20:39, 18 October 2014 (UTC)
| Date | Event | Duration in months (years) | |
|---|---|---|---|
| 1927 | Hot pitch poured | ||
| October 1930 | Stem cut | ||
| December 1938 | 1st drop fell | 98 (8.1) | |
| February 1947 | 2nd drop fell | 99 (8.2) | |
| April 1954 | 3rd drop fell | 86 (7.2) | |
| May 1962 | 4th drop fell | 97 (8.1) | |
| August 1970 | 5th drop fell | 99 (8.3) | |
| April 1979 | 6th drop fell | 104 (8.7) | |
| July 1988 | 7th drop fell | 111 (9.2) | |
| November 2000 | 8th drop fell | 148 (12.3) | |
| 17 April 2014 | 9th drop touched 8th drop | 156 (13.4) | |
| 24 April 2014 | 9th drop separated from funnel during beaker change | ||
Excellent! YewBowman (talk) 11:32, 19 October 2014 (UTC)
@Hhhippo: @YewBowman: - I am delighted to see these different alternatives and improvements! Let me suggest one more bar chart. I would like to see the key data duration shine instead of getting overshadowed by Chartjunk. The notes at bottom are for key dates from 1927, 1930, 2014. This variation incorporates facts from the timeline while allowing for an overlay of text on the bar. This feature allow for longer bars. The longer bars make it easier to see the difference between drop dates around 100 and those around 150 being 50% longer. I added the key fact about air conditioning after the 7th drop which may be the most important factor for anyone using the chart to consider the change in slope. Also, it should be noted that I standardized on months. We could make a case for using years throughout the chart. Many people think in years, not 10's or 100's of months. However, I suggest we avoid mixing both months and years on the same chart. Using two different units for the same data makes a quick visual comparison more difficult. I appreciate all of the collaboration which is building toward main article improvements. Cheers, DutchTreat (talk) 13:59, 25 October 2014 (UTC)
| Drop | Months (Date drop fell) |
|---|---|
| 1 | 98(Dec 1938[A])
|
| 2 | 99(Feb 1947)
|
| 3 | 86(Apr 1954)
|
| 4 | 97(May 1962)
|
| 5 | 99(Aug 1970)
|
| 6 | 104(Apr 1979)
|
| 7 | 111(Jul 1988)
|
| 8 | 148(Nov 2000[B])
|
| 9 | 156(Apr 2014[C])
|
- A (1927) hot pitch poured, (Oct 1930) stem cut
- B After the 7th drop, air conditioning was added, causing temperature stability.
- C (17 Apr 2014) 9th drop touched 8th drop, (24 Apr 2014) 9th drop separated from funnel during beaker change
@Hhhippo: @DutchTreat: I must say I still favour a combination of the tables, and I wouldn't call it Chartjunk. In the version below, both years (easier to grasp) and months (for the barchart) are given. The difference between 100 and 150 is clear, and the distinction between 97, 98 and 99 months is hardly significant enough to justify a broader graph. I feel this version combines the best of the alternatives so far. What do you think?
| Date | Event | Duration | ||
|---|---|---|---|---|
| Years | Months | |||
| 1927 | Hot pitch poured | |||
| October 1930 | Stem cut | |||
| December 1938 | 1st drop fell | 8.1 | 98 | |
| February 1947 | 2nd drop fell | 8.2 | 99 | |
| April 1954 | 3rd drop fell | 7.2 | 86 | |
| May 1962 | 4th drop fell | 8.1 | 97 | |
| August 1970 | 5th drop fell | 8.3 | 99 | |
| April 1979 | 6th drop fell | 8.7 | 104 | |
| July 1988 | 7th drop fell | 9.2 | 111 | |
| November 2000 | 8th drop fell[A] | 12.3 | 148 | |
| April 2014 | 9th drop[B] | 13.4 | 156 | |
- A After the 7th drop, air conditioning was added, causing temperature stability.
- B 17 Apr 2014: 9th drop touched 8th drop; 24 Apr 2014: 9th drop separated from funnel during beaker change.
— Preceding unsigned comment added by YewBowman (talk • contribs) 21:24, 26 October 2014(UTC)
- @YewBowman: I like your version. I agree we don't need high resolution bars here, since they are just for illustration, and the actual numbers are right there. The subsection in question is called "Timeline", so the durations are not really the main point anyway. I did a few minor changes within your post, hope that's ok. — HHHIPPO 21:50, 26 October 2014 (UTC)
- @Hhhippo: That's fine! Looks good to me. Will you add it to the page? YewBowman (talk) 19:49, 29 October 2014 (UTC)
- @Hhhippo: These are improvements: adding the footnotes and the bar on each row. Do you have any ideas about how to express the "drop fell" events without repeating the same words on each line? I agree that as a timeline this works fine. My original idea was to keep the timeline table and add an infographic to guide the reader to inquire about the 50% increase possibly due to air conditioning. Unfortunately without a second variable to describe the atmosphere (temp, relative humity) we can't show causation. - DutchTreat (talk) 11:09, 30 October 2014 (UTC)
- @Hhhippo:@DutchTreat: I agree that repeating "drop fell" in the same column is not great. However, the problem is that the events in this column are quite heterogeneous: poured / cut / fell / touched (with footnote). I see no simple way to reduce the text any further. YewBowman (talk) 12:23, 30 October 2014 (UTC)
- I agree. Repeating "nth drop fell" several times seems a bit redundant, but it's also very hard to avoid since we have a couple of other events and even another "nth drop" type event. Plus, these entries are not defining the column width, shortening them would just create whitespace. Another thing that looks a bit weird is the empty column header for the bar graphs, but there's just nothing one could or should put there. I think we should just use this version, it's probably the best we can do. If nobody opposes I'll put it up in the next days. — HHHIPPO 20:00, 30 October 2014 (UTC)
- I agree. DutchTreat (talk) 22:45, 30 October 2014 (UTC)
- @Hhhippo:@DutchTreat: I agree that repeating "drop fell" in the same column is not great. However, the problem is that the events in this column are quite heterogeneous: poured / cut / fell / touched (with footnote). I see no simple way to reduce the text any further. YewBowman (talk) 12:23, 30 October 2014 (UTC)
Which pitch ?[edit]
It is implied, but not clear, that this pitch is bitumen (petroleum), not coal tar or plant resin. Keith McClary (talk) 14:14, 4 October 2015 (UTC)
Alternative methods of measuring the viscosity of pitch[edit]
I imagine that it would be possible to estimate the viscosity of room temperature pitch by measuring the viscosity of more liquid pitch at a range of higher temperatures and extrapolating backwards. Have any such experiments been done? — Preceding unsigned comment added by 87.112.128.92 (talk) 08:25, 9 July 2017 (UTC)
Lord Kelvin's bullet/cork experiment[edit]
From Lord Kelvin : an account of his scientific life and work by Andrew Gray (1908)[1][2][3][4]
- "Returning to the difficulty of the elastic solid theory, that while its rigidity is enormous, it offers no obstacle to the planets and other heavenly bodies which move through it, it may be interesting to recall how Lord Kelvin used to deal with it in his elementary lectures. The same discussion was given in the Introductory Lecture at Baltimore. The difficulty is not got over by an explanation of what takes place. it is turned by showing that a similar difficulty exists in reconciling phenomena which can be observed every day with such ordinary materials as pitch or shoemakers wax. A piece of such wax can be moulded into a tuning-fork or a bell, and will then, if struck, sound a musical note of definite pitch. This indicates, for rapidly alternating deformations started by a force of short duration, the existence of internal forces of the kind called elastic, that is, depending on the amount of deformation caused, not on the rate at which the deformation is increasing or diminishing, as is the case for the so-called 'viscous forces' which are usually displayed by such material. But the tuning-fork or bell, if left lying on the table, will gradually flatten down into a thin sheet under only its own weight. Here the deformation is opposed only by viscous forces, which, as the change is very slow, are exceedingly small."
- "But let a large slab of it, three or four inches thick, be placed in a glass jar ten or twelve inches in diameter, already partly filled with water, and let some ordinary corks be imprisoned beneath, while some lead bullets are laid on the upper surface. After a month or two it will be found that the corks have disappeared from the water into the wax, and that the orifices which they made in entering it have healed up completely; similarly the bullets have sunk down into the slab, leaving no trace behind. After two or three months more, the corks will be seen to be bursting their way out through the upper surface of the slab, and the bullets will be found in the water below. The very thing has taken place that would have happened if water had been used instead of pitch, only it has taken a very much longer time to bring it about. The corks have floated up through the wax in consequence of hydrostatic upward force exerted by the wax acting as a fluid ; and the bullets have sunk down in consequence of the excess of their weights above the upward hydrostatic force exerted on them as on the corks. The motion in both cases has been opposed by the viscous forces called into play."
- "The application of this to the luminiferous ether is immediate. Let the ether be regarded as a substance which can perform vibrations only 'when times and forces are suitable,' that is, when the forces producing distortion act for only an infinitesimal time (as in the starting of the tuning-fork by a small blow), and are not too great. Vibrations may be set up locally, and the medium may have a true rigidity by which they are propagated to more remote parts ; that is to say, waves travel out from the centre of disturbance. On the other hand, if the forces are long continued, even if they be small, they produce continuously increasing change of shape. Thus the planets move seemingly without resistance. The conclusion is that the apparently contradictory properties of the ether are no more mysterious than the properties of pitch or shoemakers’ wax. And, after all, matter is still a profound mystery."
--Guy Macon (talk) 21:47, 4 August 2018 (UTC)
The Obvious Soundtrack / Theme Song[edit]
I won't add this to the article but it's obvious that if this experiment were ever to be made into a movie, the sound track should be `John Cage's As Slow as Possible. Atlant (talk) 11:43, 22 October 2021 (UTC)
- As Slow as Possible (2012). St Burchardi, Halberstadt on YouTube You're welcome. WurmWoodeT 09:11, 25 June 2022 (UTC)
Please stop "correcting" the date when the 9th drop fell.[edit]
Every so often, someone "corrects" the date when the 9th drop fell. Here are some reliable sources that give us this information:
"April 23 2014: On Thursday, the ninth dollop of pitch to fall in 83 years touched down at University of Queensland." --[ http://www.smh.com.au/technology/sci-tech/pitch-err-this-worlds-longestrunning-experiment-finally-drops-20140423-zqy9g.html ]
(Note that this is a newspaper report and that at the time the exact date of the touchdown was not well defined, but this is a reliable source for month and year.)
"As the ninth drop began to descend it ran into the tail of the eighth drop sitting in the beaker below... Making matters worse was the fact that the ninth drop wasn’t landing squarely on top of the eighth drop – it was going to make a glancing blow and continue to descend after touching down... Unfortunately the eighth drop was slightly closer to the camera than the ninth drop, making their point of contact obscured from view. But with analysis of the time-lapse it is possible to determine the date of touchdown. A discontinuity can be seen around the April 11/12 [2014] where the pitch changes from descending at a rate of 0.25mm a day to 0.1mm a day, indicating that touchdown occurred on April 11 or 12. The exact moment can be further constrained as I was fortunate enough to closely examine the pitch drop at around midday of the 11th of April [2014] (after the photo from the 11th was taken) and a small gap – just a fraction of a millimetre – was still visible between the ninth and eighth drops. "Given the rate of descent indicated in the figure above it is concluded that touchdown occurred on April 12, [2014]. On April 24, [2014] Professor White decided to replace the beaker – he took off the bell jar covering the pitch drop experiment for the first time in decades. Unbeknown to him, or anyone alive, was that there was a seal between the glass bell jar and the wooden platform upon which the experiment sits, and that seal had degraded over time. Instead of the bell jar lifting off as expected, the entire experimental setup briefly lifted up with the jar before separating and falling back down. This caused the ninth drop’s stem to separate completely from the funnel from which it was falling." - [ https://theconversation.com/explainer-the-pitch-drop-experiment-33734 ]
"On 24 April [2014] the ninth drop in the University of Queensland’s famous Pitch Drop Experiment separated during an operation to replace the beaker containing the previous eight drops." -[ http://www.uq.edu.au/news/article/2014/04/pitch-drop-experiment-enters-exciting-new-era ]
To recap, the 9th drop touched the eighth drop on April 12, 2014 and was broken off by the action of a human on April 24, 2014. No reasonable person would define the April 24 event as "dropping" in the way we used the word for all previous drops (naturally separating from the beaker because of gravity). That simply did not happen with the 9th drop, and thus we can not know exactly when it would have dropped. (naturally separating from the beaker because of gravity). Thus the article should say that the 9th drop "dropped" in April of 2014 with a footnote giving the two dates and explaining what actually happened and when. Please do not change this without discussing it here on the talk page first. --Guy Macon (talk) 13:43, 4 May 2017 (UTC)
As a cross-check to make sure we have the right dates for earlier drops, I was recently watching a YouTube video ( https://www.youtube.com/watch?v=c6wuh0NRG1s time=1:04 ) that showed the wording on the wall next to the pitch drop experiment. It reads:
- 1927 Poured into funnel
- 1930 October Glass stem cut
- 1938 December 1st Drop fell
- 1947 February 2nd Drop fell
- 1954 April 3rd Drop fell
- 1962 May 4th Drop fell
- 1970 August 5th Drop fell
- 1979 April 6th Drop fell
- 1988 July 7th Drop fell
- 2000 November 8th Drop fell
Can someone in Australia who is reading this take a picture of that sign, upload it where we can see it, and give it a CC BY-SA 3.0 License so we can use it on Wikipedia? Thanks! --Guy Macon (talk) 05:33, 31 May 2017 (UTC)
- From The University of Queensland ( https://www.uq.edu.au/news/article/2014/11/explainer-pitch-drop-experiment ):
- "When something, such as water or pitch, drips the drop starts with zero velocity, then freefalls accelerating at 9.8m/s2, and comes to a stop when it crashes to the ground.
- "Determining when this happens is easy because of the noticeable changes in velocity. Unfortunately, the ninth drop wasn’t going to freefall, so it wouldn’t have a sudden increase in speed.
- "Making matters worse was the fact that the ninth drop wasn’t landing squarely on top of the eighth drop – it was going to make a glancing blow and continue to descend after touching down.
- "This meant that determining the moment the ninth drop touches down was a matter of noticing its rate of descent change from an incredibly slow velocity to an even slower one.
- "No one on earth could possibly hope to see when that change occurred. The best guess of observers initially had the time of touchdown to within a four-day period of April 11-14 2014.
- "It was hoped that touchdown could be seen in the time-lapse video – which was constructed from a series of still images taken once per day thereby speeding up the movement two million times.
- "Unfortunately the eighth drop was slightly closer to the camera than the ninth drop, making their point of contact obscured from view. But with analysis of the time-lapse it is possible to determine the date of touchdown.
- "In an analysis by Dr Anthony Jacko and myself the plot (below) shows the position of the drop April 4-23. The slope of the data indicates the speed at which the pitch is descending.
- "A discontinuity can be seen around the April 11/12 where the pitch changes from descending at a rate of 0.25mm a day (blue line) to 0.1mm a day (green line), indicating that touchdown occurred on April 11 or 12.
- "The exact moment can be further constrained as I was fortunate enough to closely examine the pitch drop at around midday of the 11th of April (after the photo from the 11th was taken) and a small gap – just a fraction of a millimetre – was still visible between the ninth and eighth drops.
- "Given the rate of descent indicated in the figure above it is concluded that touchdown occurred on April 12."
- I see that this date has been corrected and recorrected several times. Please revert any edit that does not indicate that the ninth drop touched the eighth drop on 12 April 2014. --Guy Macon Alternate Account (talk) 08:54, 4 January 2024 (UTC)
- I noticed it was off the other day, but I did not see any evidence in the page history of it having been changed anytime recently. I've added the proper reference and I've also requested the notice on the edit page reflect the correct date. This has been done now. Hopefully that's enough to avoid any more overzealous edits. JoinTheMadVender (talk) 02:18, 5 January 2024 (UTC)