
File:Ws-el-price-2009-2012red.svg

Size of this PNG preview of this SVG file: 578 × 434 pixels. Other resolutions: 320 × 240 pixels | 639 × 480 pixels | 1,023 × 768 pixels | 1,280 × 961 pixels | 2,560 × 1,922 pixels.
Original file (SVG file, nominally 578 × 434 pixels, file size: 44 KB)
| This is a file from the Wikimedia Commons. Information from its description page there is shown below. Commons is a freely licensed media file repository. You can help. |
Summary
| Description |
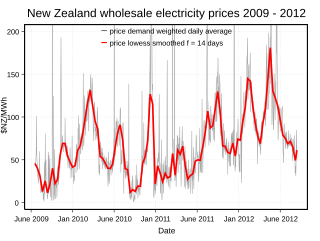
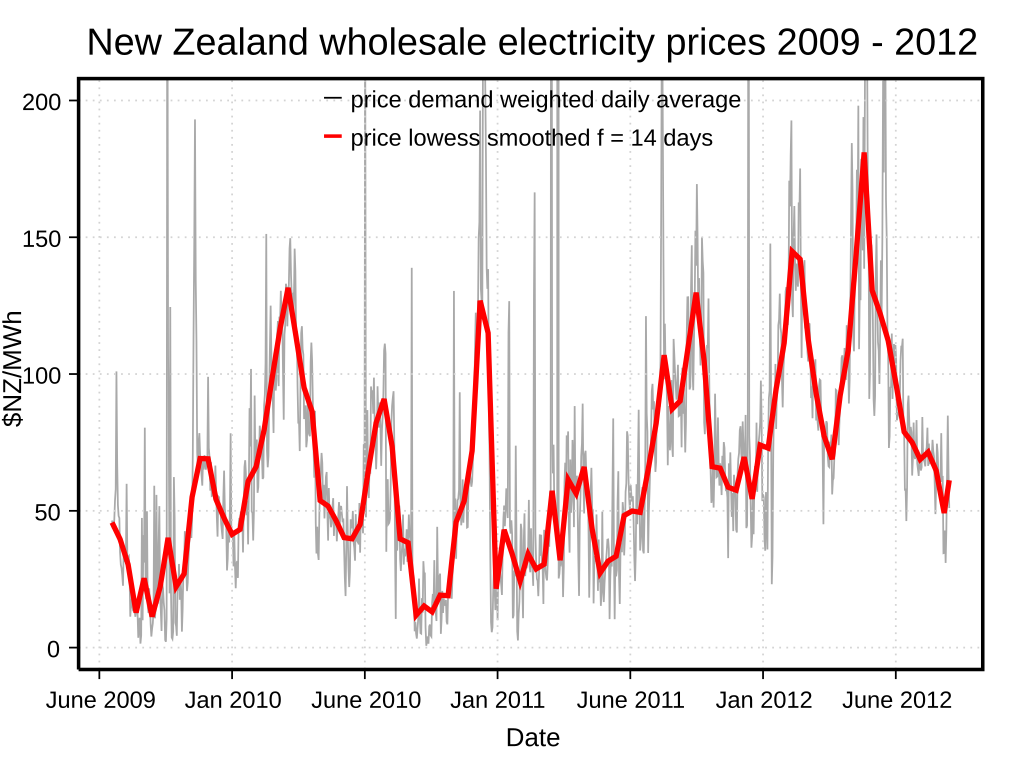
English: New Zealand demand-weighted daily average wholesale price of electricity Data from New Zealand Electricity Authority http://www.reports.ea.govt.nz/OnlineReports.aspx |
| Date | |
| Source | Own work |
| Author | Mrfebruary |
| SVG development | |
| Source code | R codep <- read.csv("demandweighteddailyaverageprice2012.csv", skip = 0,header=TRUE, sep=",", na.strings="na", dec=".", strip.white=TRUE)
#examine data
str(p)
'data.frame': 1152 obs. of 2 variables:
$ Date : Factor w/ 1152 levels "10/01/2010","10/01/2011",..: 501 545 583 621 659 697 735 773 809 844 ...
$ Price: num 46.5 43.5 45.5 46.5 53.8 ...
# 5 number summary of price
summary(p$Price)
Min. 1st Qu. Median Mean 3rd Qu. Max.
0.6819 38.0900 62.0500 71.7400 91.6000 2911.0000
# convert p$Price into time series
pts<-ts(p$Price, frequency = 365, start = c(2009, 201))
# examine time series object
str(pts)
Time-Series [1:1152] from 2010 to 2013: 46.5 43.5 45.5 46.5 53.8 ...
# load SVG device
library("RSVGTipsDevice")
# define name and size of SVG graphic to be created by SVG device
devSVGTips(file="ws-el-price-2009-2012red.svg",toolTipMode=0,width=8,height=6)
# plot commands
plot(pts,ylim=c(0,200),axes="FALSE",type="l",col="darkgrey",cex.main=1.6, main="New Zealand wholesale electricity prices 2009 - 2012",las=1,xlab="Date",ylab="$NZ/MWh")
axis(side=1, las=1,line =0 ,at=c(2009.5,2010.0,2010.5,2011.0,2011.5,2012.0,2012.5), labels=c("June 2009","Jan 2010","June 2010","Jan 2011","June 2011","Jan 2012","June 2012"))
axis(side=2, las=2)
grid()
lines(lowess(pts,f = 14/1152),type="l",col=2,lty=1,lwd=3)
legend("top",bty='n',bg="white", c("price demand weighted daily average","", "price lowess smoothed f = 14 days"), lty = c(1,NA,1),lwd=c(1,NA,2), pch=c(NA,NA,NA),col = c(1,NA,2))
box(lwd=2)
# turn off plotting device (SVG)
dev.off()
|
Licensing
I, the copyright holder of this work, hereby publish it under the following license:
This file is licensed under the Creative Commons Attribution-Share Alike 3.0 Unported license.
- You are free:
- to share – to copy, distribute and transmit the work
- to remix – to adapt the work
- Under the following conditions:
- attribution – You must give appropriate credit, provide a link to the license, and indicate if changes were made. You may do so in any reasonable manner, but not in any way that suggests the licensor endorses you or your use.
- share alike – If you remix, transform, or build upon the material, you must distribute your contributions under the same or compatible license as the original.
File history
Click on a date/time to view the file as it appeared at that time.
| Date/Time | Thumbnail | Dimensions | User | Comment | |
|---|---|---|---|---|---|
| current | 02:03, 6 October 2012 | | 578 × 434 (44 KB) | Mrfebruary | User created page with UploadWizard |
File usage
The following pages on the English Wikipedia use this file (pages on other projects are not listed):