
File:Sum of two points on an Edwards curve.svg

Size of this PNG preview of this SVG file: 540 × 540 pixels. Other resolutions: 240 × 240 pixels | 480 × 480 pixels | 768 × 768 pixels | 1,024 × 1,024 pixels | 2,048 × 2,048 pixels.
Original file (SVG file, nominally 540 × 540 pixels, file size: 26 KB)
| This is a file from the Wikimedia Commons. Information from its description page there is shown below. Commons is a freely licensed media file repository. You can help. |
Summary
| Description |
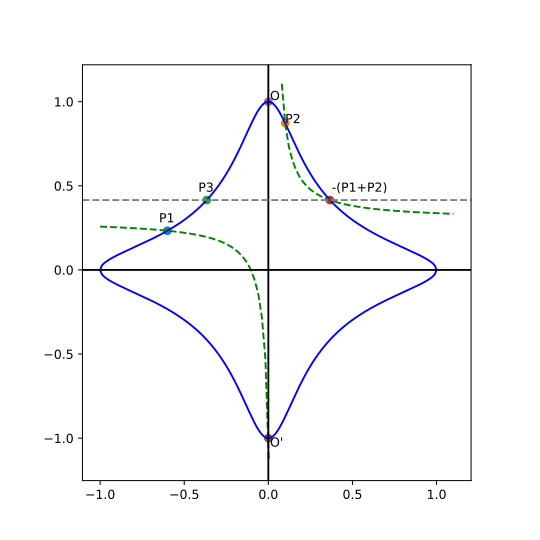
English: The plot presents the geometry meaning of point addition on the Edwards curves .
Here you can see the sum of two points on the curve with . Point has x-coordinate -0.6, point has x-coordinate 0.1. Unlike the traditional elliptic curves where points , and lay on the straight line, in the case of the Edwards curves the points , and lay on a conic . The graph was created using the following script: import matplotlib.pyplot as plt
import numpy as np
import math
from collections import namedtuple
# Utility type
Point = namedtuple('Point', ['x', 'y'])
d = -30
def edwards_y(x):
return np.sqrt((x*x - 1)/(d*x*x - 1))
# Draw Edwards curve
x = np.linspace(-1,1,200)
ypos = edwards_y(x)
yneg = -ypos
plt.figure(figsize=[6, 6])
plt.plot(x,ypos, 'b')
plt.plot(x,yneg, 'b')
# Draw neutral point
plt.scatter(0,1)
plt.annotate("O", (0.01, 1.01))
# Draw order 2 point
plt.scatter(0,-1)
plt.annotate("O'", (0.01, -1.05))
# Draw the points P1 and P2
P1=Point(-0.6, edwards_y(-0.6))
P2=Point(0.1, edwards_y(0.1))
plt.scatter(*P1)
plt.annotate("P1", (P1.x-0.05, P1.y+0.05))
plt.scatter(*P2)
plt.annotate("P2", P2)
# Compute and draw P1 + P2
def edwards_sum(x1,y1,x2,y2):
return ( (x1*y2+x2*y1)/(1+d*x1*x2*y1*y2) , (y1*y2 - x1*x2)/(1-d*x1*x2*y1*y2) )
P3 = Point(*edwards_sum(*P1, *P2))
plt.scatter(*P3)
plt.annotate("P3", (P3.x-0.05, P3.y+0.05))
P3_ = Point(-P3.x, P3.y)
plt.scatter(*P3_)
plt.annotate("-(P1+P2)", (P3_.x+0.01, P3_.y+0.05))
# Draw the line that connects P3 and -P3
plt.axhline(P3.y, linestyle='--', color="grey")
# Draw the conic that P1, P2 and -(P1+P2) belong to
def conic_coefs(x1,y1,x2,y2):
"Computes coeffitiens of the quadratic form Axy + Bx + Cx + D"
return (x1-x2 + (x1*y2-x2*y1),
(x2*y2-x1*y1)+y1*y2*(x2-x1),
x1*x2*(y1-y2),
x1*x2*(y1-y2)
)
def conic_y(x, A,B,C,D):
return -(B*x + D)/(A*x + C)
A,B,C,D = conic_coefs(*P1,*P2)
# Left and right branches of the hyperbole
xleft = np.linspace(-1,0.003,50)
xright = np.linspace(P2[0] - 0.02, 1.1, 50)
yleft = conic_y(xleft, A,B,C,D)
yright = conic_y(xright, A,B,C,D)
plt.plot(xleft, yleft,"--", color="green")
plt.plot(xright, yright,"--", color="green")
# Draw axis lines
plt.axhline(0, color='black')
plt.axvline(0, color='black')
# Set same scale on x and y
plt.gca().set_aspect('equal', adjustable='box')
plt.savefig("Add_points_Edwards.svg")
Русский: График иллюстрирует геометрический смысл сложения точек на кривых Эрдвадса .
На графике изображено сложение двух точек на кривой с параметром . Точка с x-координатой -0.6, точка с x-координатой 0.1. В отличие от традиционных эллиптических кривых, где точки , и лежат на прямой, на кривых Эдвардса точки , и лежат на гиперболе . |
| Date | |
| Source | Own work |
| Author | Pakuula |


Licensing
I, the copyright holder of this work, hereby publish it under the following license:
This file is licensed under the Creative Commons Attribution-Share Alike 4.0 International license.
- You are free:
- to share – to copy, distribute and transmit the work
- to remix – to adapt the work
- Under the following conditions:
- attribution – You must give appropriate credit, provide a link to the license, and indicate if changes were made. You may do so in any reasonable manner, but not in any way that suggests the licensor endorses you or your use.
- share alike – If you remix, transform, or build upon the material, you must distribute your contributions under the same or compatible license as the original.
File history
Click on a date/time to view the file as it appeared at that time.
| Date/Time | Thumbnail | Dimensions | User | Comment | |
|---|---|---|---|---|---|
| current | 04:24, 20 December 2020 | | 540 × 540 (26 KB) | Pakuula | Uploaded own work with UploadWizard |
File usage
The following pages on the English Wikipedia use this file (pages on other projects are not listed):
Global file usage
The following other wikis use this file:
- Usage on ru.wikipedia.org